
MCP server
HeliosLogs includes a Model Context Protocol server, exposing the same tool catalog the built-in agent uses to any MCP client — Claude Desktop, Claude Code, Cursor, and others. Point a client at HeliosLogs and your assistant can search and analyze your logs directly.
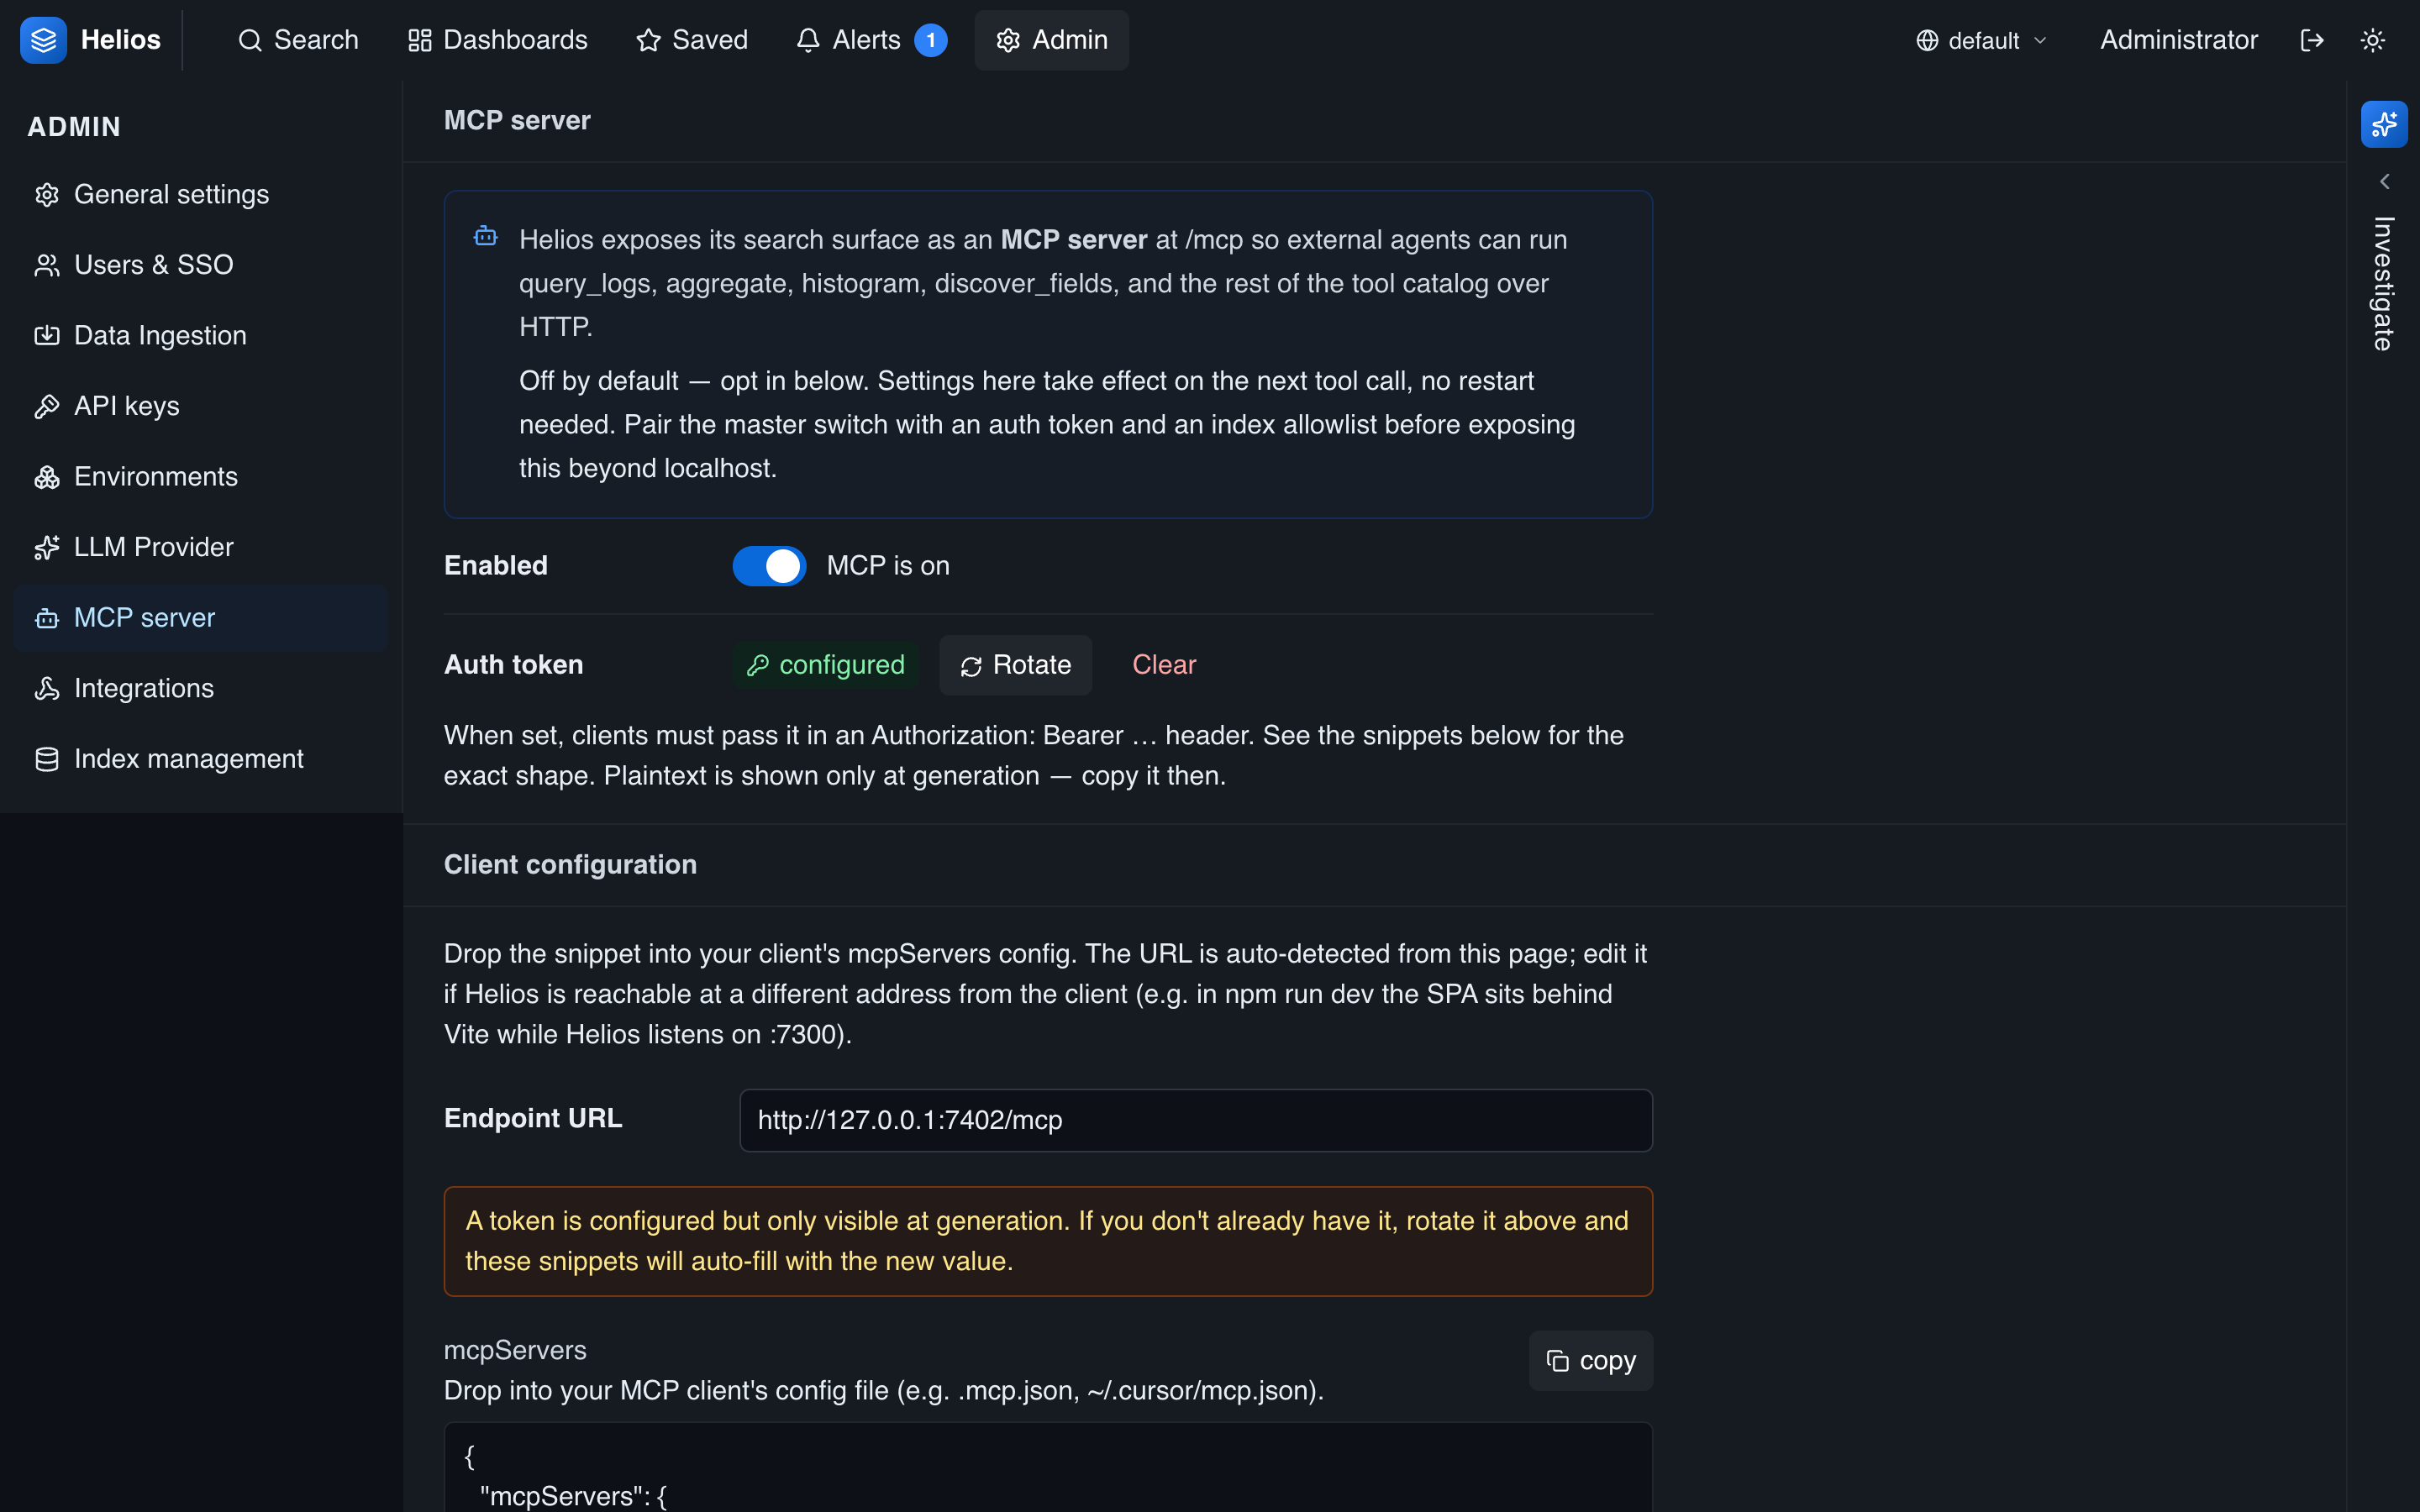
Configure it under Admin → MCP:
Endpoint
POST /mcp # JSON-RPC 2.0 over HTTPThe endpoint is off by default — opt in with the master switch. There's no restart: settings take effect on the next tool call.
Scoping access
MCP exposes the same powerful toolset as the built-in agent, but to external clients that aren't tied to a logged-in user. Scope it deliberately, in four layers — each narrows what a connected assistant can see or do:
| Control | Notes |
|---|---|
| Enabled | Master switch. When off, tools/list is empty and every call errors — the safe default. |
| Authentication | Access is gated by API keys, not a per-server token. Create a key with the MCP server scope and send it as Authorization: Bearer hlk_…. Until the first MCP-scoped key exists the endpoint is open; once one exists, every call needs a valid key. Each call is attributed to its key in the activity log, so give every user or integration its own key. |
| Index allowlist | Restricts which environments and indexes MCP can read. Empty = unrestricted (everything the server holds). |
| Tool allowlist | Which tools are exposed. * (default) = all; otherwise only the listed tools appear in tools/list, and any other call is rejected. |
Index & environment allowlist
The allowlist is a list of (environment, indexes) entries — the same shape as a non-admin user's RBAC allowlist:
- Empty list — unrestricted: MCP can reach every environment and index.
- An environment with no indexes — all indexes in that environment.
- An environment with specific indexes — only those indexes, in that environment.
The restriction is applied at the catalog layer, so it's transparent and total: list_environments returns only permitted environments, list_indexes only permitted indexes, and query_logs / histogram / aggregate can only ever touch partitions in the allowlist. A client can't read — or even enumerate — anything outside it. To grant a read-only assistant access to just your app logs in production, allow prod → [apache_access, python_app] and nothing else.
Tool allowlist
The catalog mixes read tools with write tools (ingest_events, create_dashboard, update_dashboard, create_monitor, update_monitor, acknowledge_alert). For a read-only surface, enable only the read tools and leave the write ones off — disabled tools never appear in tools/list and are rejected even if a client calls them by name.
Scope it before exposing
With the write tools enabled, MCP can modify dashboards and monitors and ingest data — not just read. Before connecting external clients, especially over the network: create an MCP-scoped API key (so calls are authenticated and attributable), restrict the index allowlist to what the assistant needs, and trim the tool allowlist to the read tools unless writes are required. See Security hardening.
Tool catalog
| Tool | What it does |
|---|---|
list_indexes | List the indexes in the catalog. |
list_environments | List the environments the allowlist permits. |
list_partitions | Per-(index, day) document counts and on-disk size. |
get_stats | Catalog rollup: documents, segments, partitions. |
get_index_info | Schema and counts for one partition or the whole catalog. |
discover_fields | Sample events and rank the JSON fields present. |
query_logs | Search events; supports pipe operators for analytics. |
histogram | Event counts over time — spot incidents and ingest gaps. |
aggregate | Top values for a field (terms aggregation). |
ingest_events | Bulk-ingest JSON events into a partition. |
list_dashboards | List dashboards visible to MCP. |
get_dashboard | Fetch one dashboard's full widget/layout spec. |
create_dashboard | Create a (public) dashboard. |
update_dashboard | Edit a public dashboard's name or widgets. |
list_alerts | List alerts visible to MCP. |
acknowledge_alert | Acknowledge an alert (clears it from every inbox). |
list_monitors | List monitors visible to MCP. |
create_monitor | Create a (public) recurring AI or threshold monitor. |
update_monitor | Edit a public monitor's schedule, prompt, threshold, or enabled state. |
The read tools accept the same query language and time arguments as the search API (q, index, start/end as ISO 8601, unix ms, or relative like -15m).
Connecting a client
First create an API key with the MCP server scope on the API keys page (the secret is shown once — copy it then). The MCP admin panel generates ready-to-paste snippets; drop your hlk_… key into the Authorization header. The standard mcpServers configuration (Claude Desktop, Cursor, …):
{
  "mcpServers": {
    "helios": {
      "type": "http",
      "url": "https://helios.example.com/mcp",
      "headers": {
        "Authorization": "Bearer hlk_<your-api-key>"
      }
    }
  }
}
For Claude Code, add it as an HTTP MCP server pointing at the same /mcp URL with the same header. (You can omit headers only while no MCP-scoped key exists yet, when the endpoint is still open.)
Smoke-test the endpoint with curl:
curl -X POST https://helios.example.com/mcp \
  -H 'content-type: application/json' \
  -H 'Authorization: Bearer hlk_<your-api-key>' \
  -d '{"jsonrpc":"2.0","id":1,"method":"tools/list"}'
Observing MCP activity
Every MCP tool call is recorded in the _heliosmcp self-log (tool, status, duration, arguments, and the API key that made it — api_key_name / api_key_id). The MCP admin panel shows recent calls with their key, and you can query the full history in the _system environment — handy for seeing which assistant (key) is doing what. Search index:_heliosmcp api_key_name:"<name>" to audit a single key.