
Pipeline operators
Pipe a search expression into one or more | ... stages to aggregate, sort, filter, and reshape results — like a Unix pipeline for your logs. Pre-aggregation filtering stays in the search expression; the pipe stages operate on what it returns.
elb_status_code:>=500 | stats count by target_group | sort -count | head 10Most stages — stats, top, rare, where, fields, rename — turn the event list into a results table. timechart produces a time-series chart. The two sections below show each.
stats — aggregate
| stats <agg>, <agg>, … [by <field>, …] computes metrics, optionally grouped.
Aggregation functions:
| Function | Result |
|---|---|
count (also count(), count(*)) | Number of events. |
sum(field) | Sum of a numeric field. |
avg(field) (alias mean) | Average. |
min(field) / max(field) | Extremes. |
p50(field) (alias median), p95(field), p99(field) | Percentiles. |
earliest(timestamp) / latest(timestamp) | Earliest/latest timestamp (only on timestamp). |
* | stats count by service
* | stats avg(latency_ms), p95(latency_ms), max(latency_ms) by service
* | stats count, sum(bytes) by status, method
* | stats earliest(timestamp), latest(timestamp) by trace_id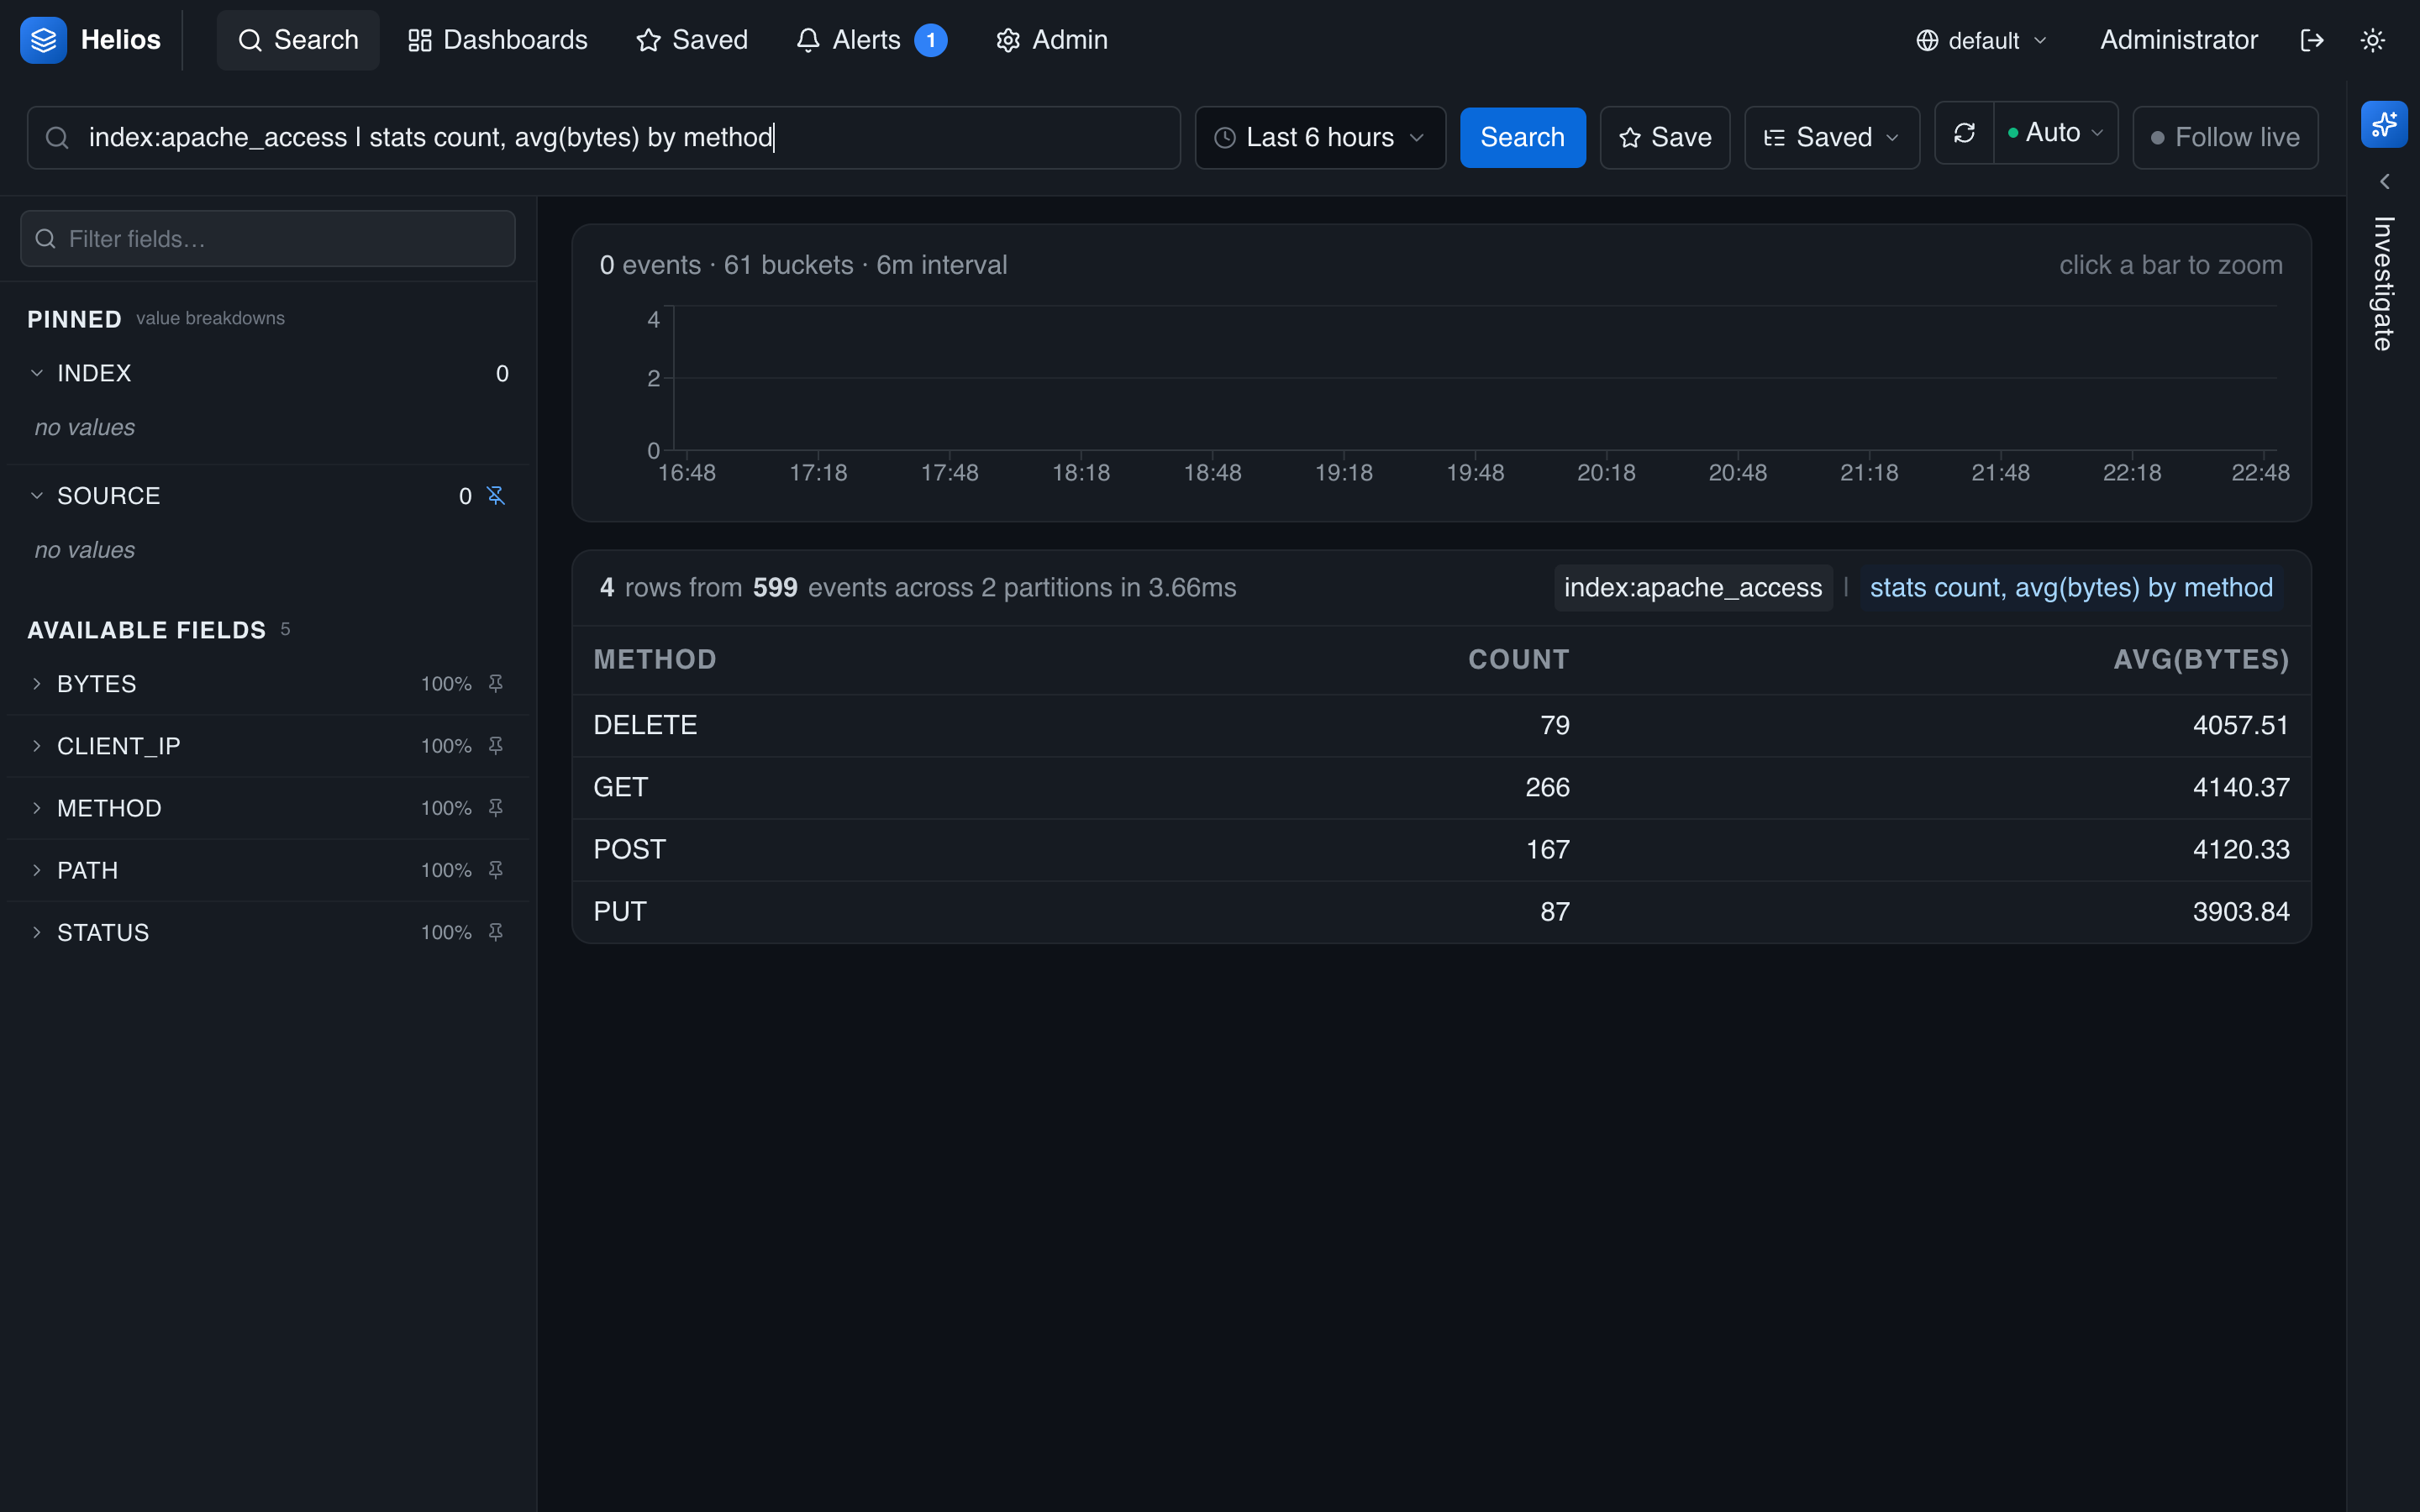
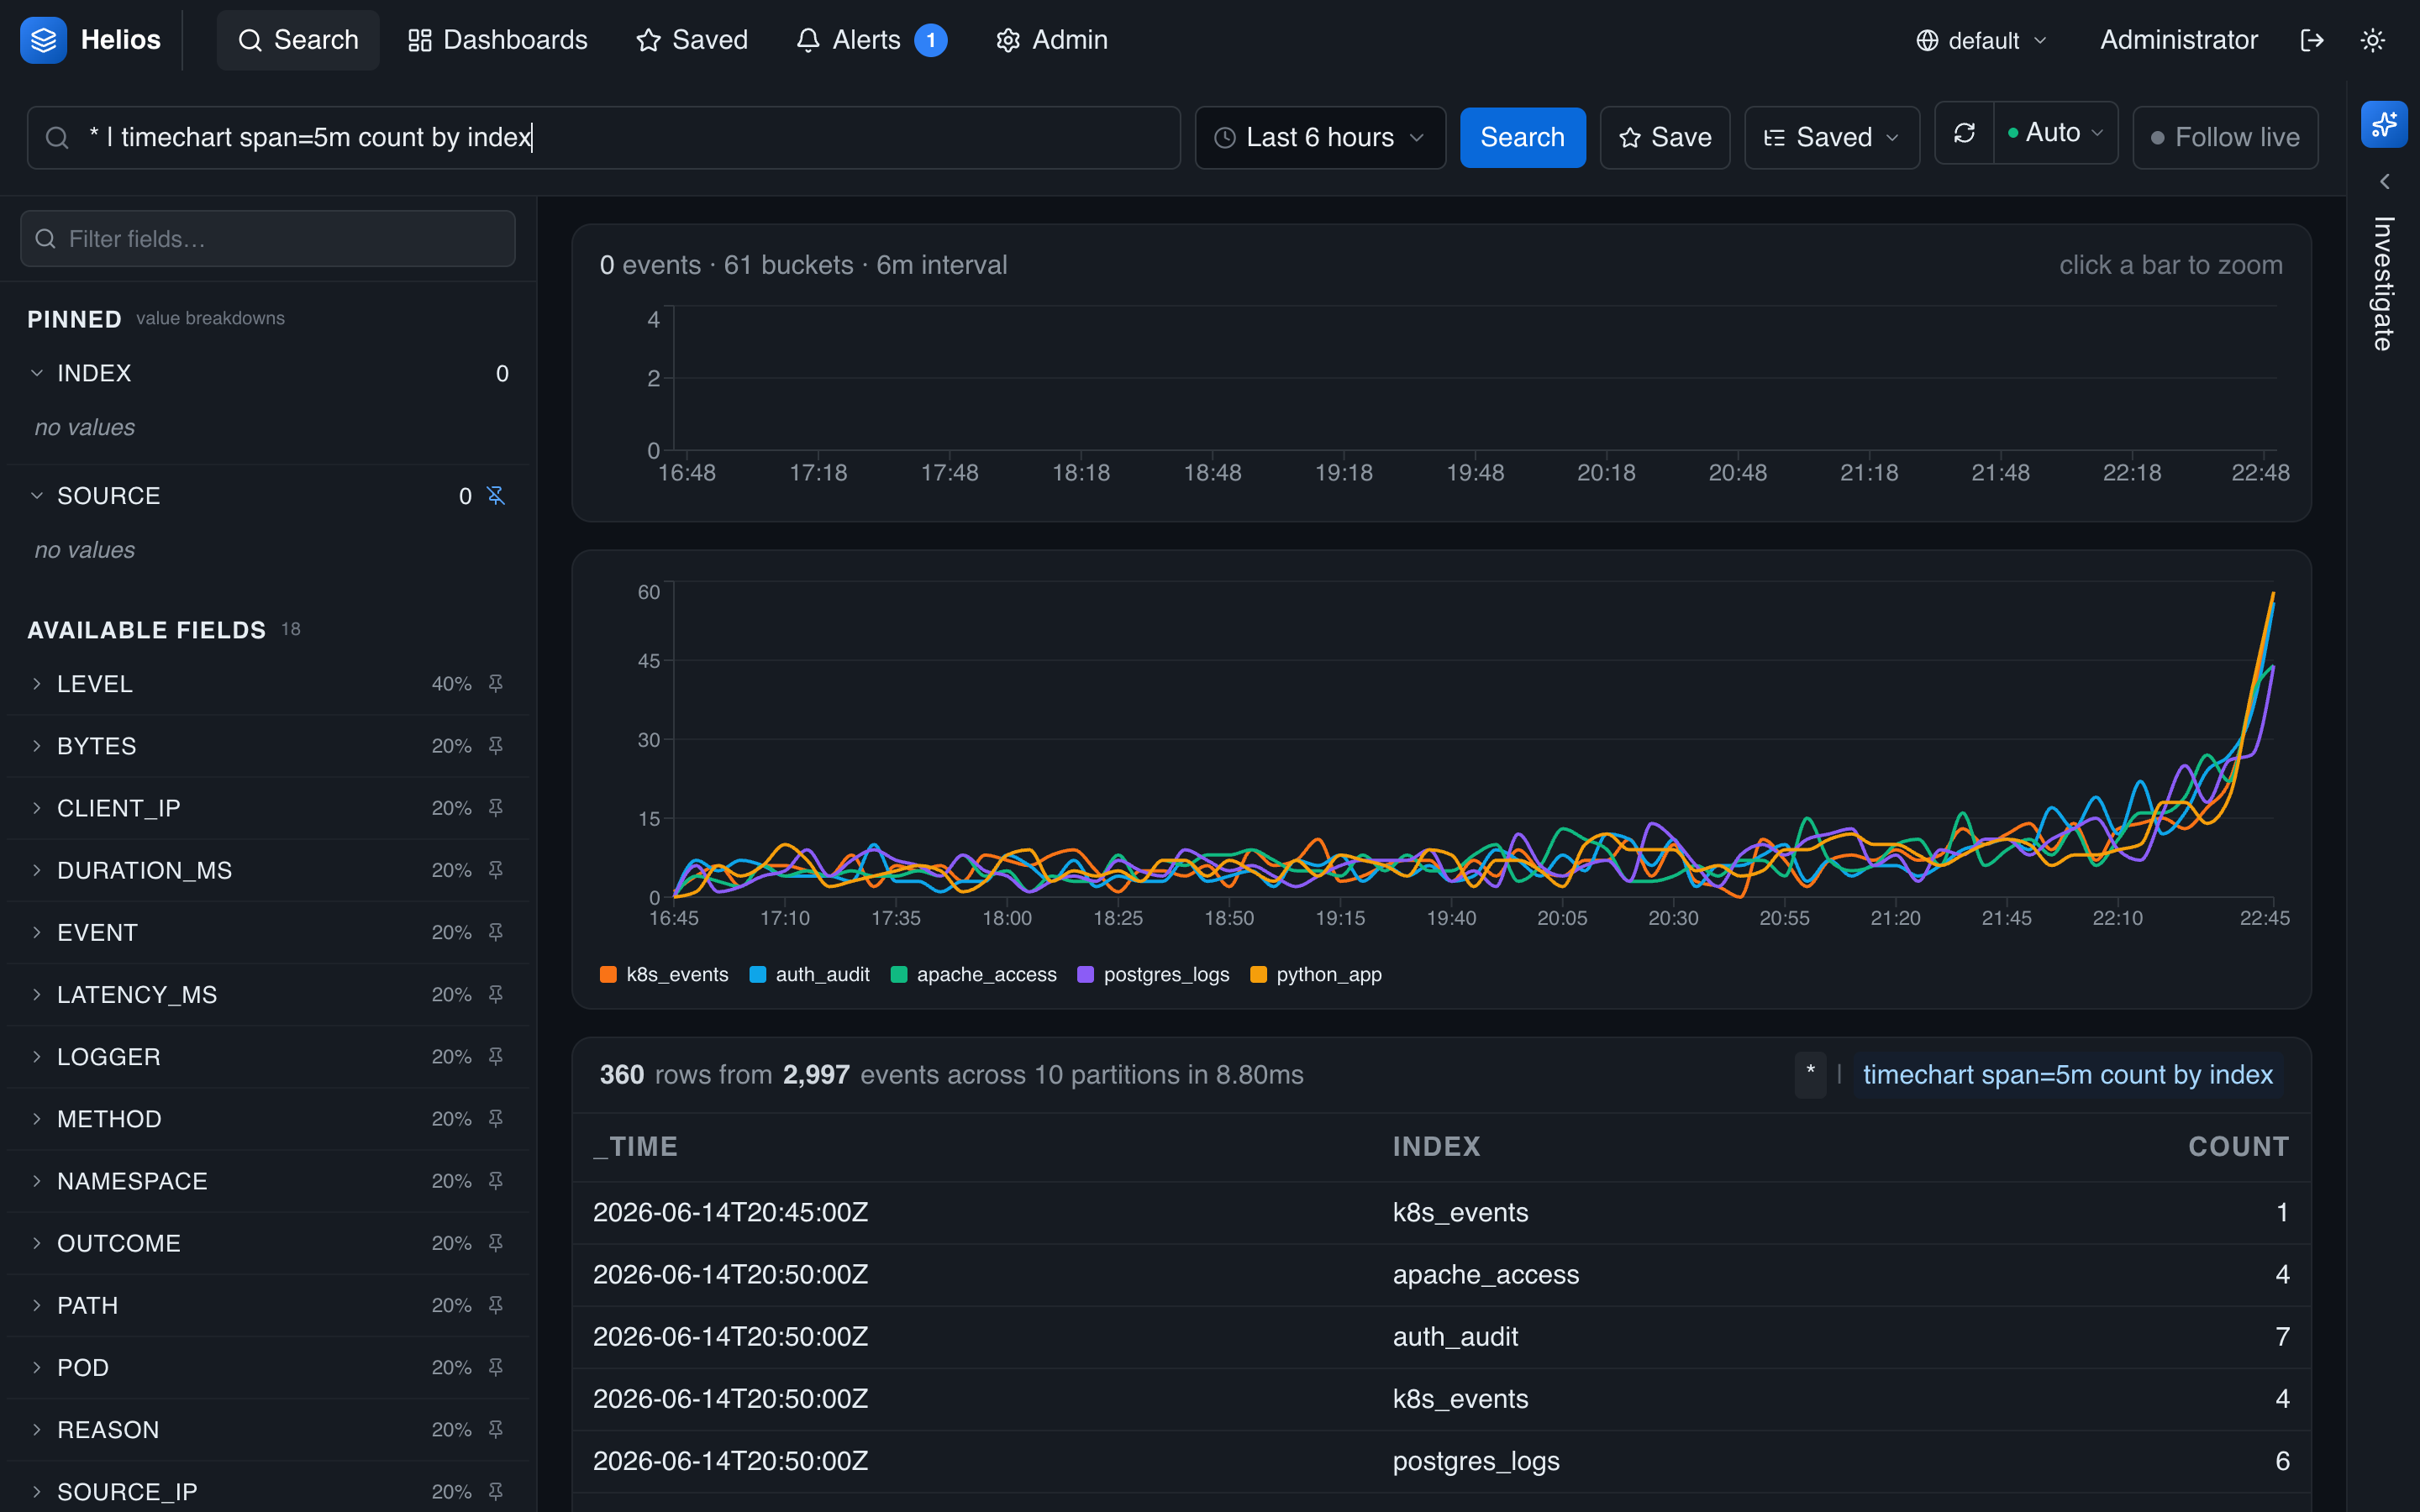
timechart — aggregate over time
| timechart [span=<interval>] <agg>, … [by <field>, …] buckets results into time intervals, producing a multi-series chart. Omit span= to auto-size it to the time range.
* | timechart span=5m count
* | timechart span=1h avg(latency_ms) by service
* | timechart span=30s p95(duration_ms), p99(duration_ms)
Span units: ms, s, m, h, d (e.g. span=5m, span=1h).
top / rare — most / least frequent
| top N <field> returns the N most frequent values; | rare N <field> the least.
level:error | top 5 error_type
* | rare 10 http_method
Row operators
These reshape the aggregated table:
| Operator | Effect |
|---|---|
sort [-]<field> | Sort ascending, or descending with a leading -. |
head N | Keep the first N rows. |
tail N | Keep the last N rows. |
where <col> <op> <value> | Filter rows. Operators: = (or ==), !=, >, >=, <, <=. |
fields [-] a, b | Keep only the listed columns — or drop them with a leading -. |
rename <old> as <new> | Rename output columns. |
* | stats count by service | where count > 100 | sort -count
* | stats count by svc | rename count as n | fields svc, n
* | timechart span=1h count | tail 24
Pre-stats vs. post-stats filtering
Filter raw events in the search expression (level:error | stats …); use where to filter the aggregated rows (… | stats count by service | where count > 100).
Recipes
# Error rate by service
level:error | stats count by service | sort -count

# Latency p95 per service over time
* | timechart span=5m p95(latency_ms) by service

# Top 5 status codes among 5xx
elb_status_code:>=500 | top 5 elb_status_code

# Per-trace time bounds
* | stats earliest(timestamp), latest(timestamp) by trace_id | head 100

# Services with more than 1000 errors, renamed for a report
level:error | stats count by service | where count >= 1000 | rename count as errors | sort -errors
In the UI, a query with a pipe renders as a table (or chart, for timechart) instead of the event list. See The search interface.